


Overview
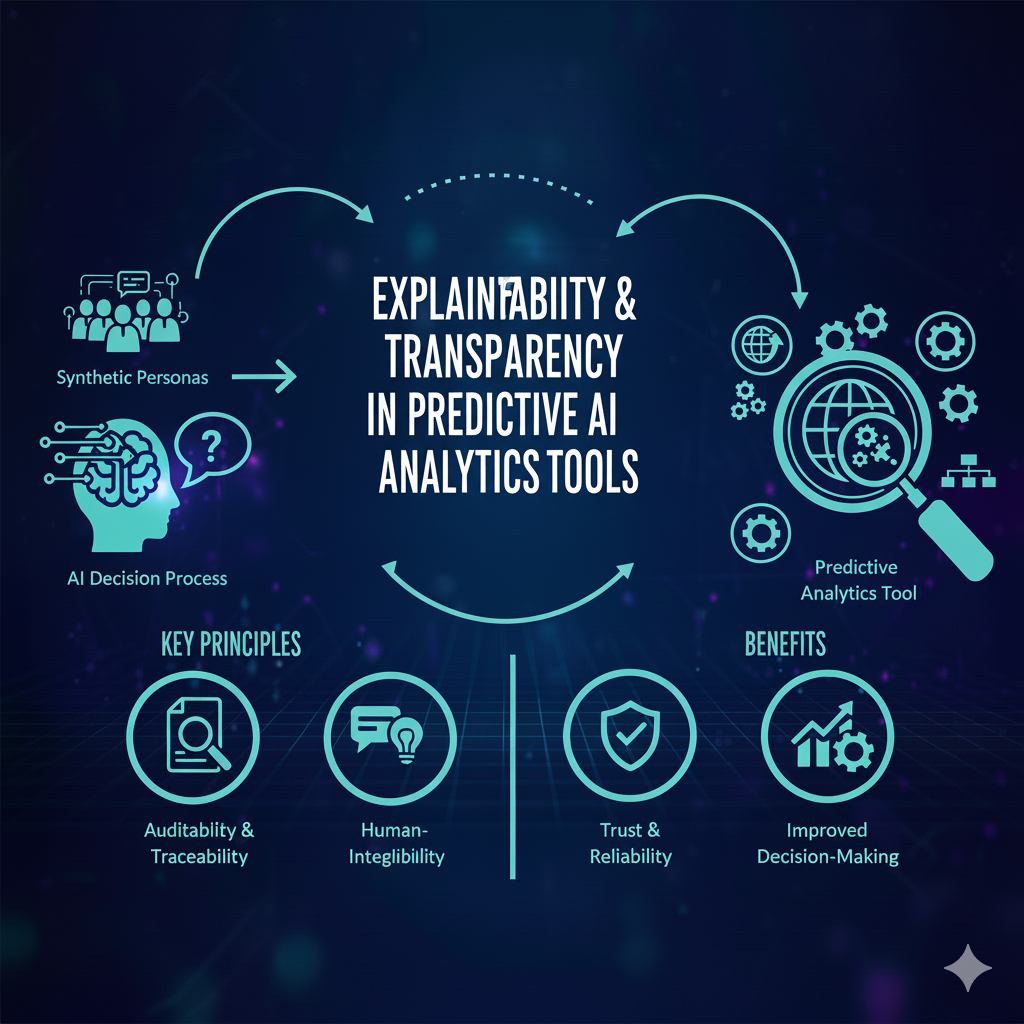
In today’s data-driven world, businesses demand more than black-box predictions — they need insight, accountability, and trust. Explainability and transparency are no longer optional. In this post, we examine why explainability matters in predictive analytics software, how it ties into market research platform use cases, key techniques, trade-offs, and a practical guide to implementing transparent systems.
Introduction
Organizations that adopt predictive analytics software often face skepticism: “Why did the model make this prediction?” or “Can we trust this?” When embedded into a market research platform, black-box models can hamper adoption, auditability, and regulatory compliance. Explainability and transparency are crucial to bridge the gap between technical models and human decision makers. In this article, we unpack what explainability means in context, survey techniques (local, global, post hoc, intrinsic), discuss trade-offs and pitfalls, and propose a roadmap for embedding these in predictive analytics software within market research platforms.
Why Explainability & Transparency Matter
Building Trust and Adoption
Even a highly accurate model can be rejected if end users (analysts, clients, marketing leads) don’t understand or trust it. Explainability fosters credibility, helps decision makers interpret forecasts, and drives adoption.
Regulatory & Ethical Requirements
In many sectors (finance, healthcare, consumer targeting), regulations or best practices require model justification and auditability. Transparent models help satisfy compliance and reduce legal risk.
Debugging, Bias Detection & Model Improvement
When models fail or make unexpected predictions, explainability helps diagnose failure modes, detect data bias or spurious correlations, and correct overfitting or drift.
Aligning with Business Logic
In a market research platform, domain experts often expect patterns aligned with known theory. Explanations help align model behavior with domain logic — for instance, “why did this segment respond negatively?” — ensuring that insights are actionable and credible.
Supporting Continuous Deployment & Monitoring
Transparent predictions are easier to monitor, compare over time, and trigger alerts if certain features behave anomalously or explanations change sharply under drift.
Dimensions of Explainability & Transparency
Explainability is not a single monolithic concept. Instead, it spans multiple dimensions:
- Intrinsic vs Post hoc: Intrinsic (transparent models built for interpretability, e.g. decision trees, rule lists) vs post hoc explanations applied to black boxes (e.g. using SHAP, LIME).
- Global vs Local: Global explanations describe overall model logic (e.g. feature importance across the model). Local explanations clarify individual predictions (e.g. why this user got this score).
- Model-agnostic vs Model-specific: Some methods work regardless of model type; others are tailored to specific algorithms (e.g. saliency maps for neural nets).
- Auditable vs Interactive vs Narrative: Explanations may be static (audit logs), interactive (dashboards), or narrative (textual explanations).
- Simulatability, Decomposability, Algorithmic Transparency: Some frameworks classify transparency in these axes: simulatability (can a human simulate model?), decomposability (can parts be understood?), algorithmic transparency (is learning logic clear?).
Core Techniques & Tools
Here are widely used explainability tools that can be integrated into predictive analytics software or deployed in a market research platform.
SHAP (SHapley Additive exPlanations)
SHAP attributes each feature’s contribution to a prediction using game-theoretic Shapley values. It supports both global and local explanations, and many frameworks integrate SHAP directly.
LIME (Local Interpretable Model-agnostic Explanations)
LIME perturbs the input around a prediction and fits a simple surrogate model to approximate the local decision boundary. It’s flexible but may suffer instability.
Counterfactual / Contrastive Explanations
These methods answer “What minimal change in features would flip the prediction?” This is often intuitive to business users — e.g. “if purchase intent drops if price increases by $5.”
Partial Dependence Plots / ICE (Individual Conditional Expectation)
These plots show how predictions change when a feature varies, holding others constant. Useful for global insights.
Feature Interaction & Dependence Measures
Metrics that capture how features interact (e.g. via SHAP interaction values) help explain complex non-linear dependencies.
Surrogate Models & Rule Extraction
Train a simpler, interpretable model (e.g. decision tree) to mimic the predictions of a complex model; use the surrogate to explain behavior.
Visual Analytics & Interactive Tools
Tools like XAutoML provide visual interfaces to explore pipeline decisions, hyperparameter choices, feature engineering steps, and reasoning paths.
Auditing Metrics & Stability Checks
Beyond point explanations, tracking whether feature importances shift over time or under drift is a transparency tool in itself. The recent work Model Interpretation and Explainability: Towards Creating Transparency in Prediction Models cautions that static feature importance may diverge from dynamic “what-if” importance.
Embedding Explainability in Market Research Platforms
Below is a suggested roadmap and best practices for integrating explainability and transparency into predictive analytics software used within a market research platform.
Step 1: Decide Explainability Requirements by Stakeholder
Segment your users: data scientists, business analysts, client stakeholders. Tailor explanations (detail vs narrative) for each audience.
Step 2: Prioritize Transparency for Critical Models
Not every model needs full transparency. Focus on high-stakes or public-facing ones (e.g. recommendation engines, segmentation predictions).
Step 3: Select Core Techniques
Start with SHAP or LIME, add counterfactuals or surrogate models for key features. Use partial dependence plots or interaction maps.
Step 4: Instrument Interactive Dashboards
Embed explanation dashboards in your platform: allow users to click into a prediction and see “why”, change input values, and see resulting shifts dynamically.
Step 5: Audit & Monitor Explanation Drift
Track whether explanations for similar predictions drift over time (e.g. a feature’s importance suddenly disappears or flips sign). Use this as a red flag for model retraining or review.
Step 6: Versioning, Logging & Traceability
Maintain logs of explanations, model versions, feature sets, and user queries. Enables auditing, rollback or investigation later.
Step 7: Human Review Loops
Allow domain experts to review questionable explanations or predictions. Incorporate feedback to constrain, correct, or re-tune models.
Step 8: Educate Users
Train analysts and business users on how to interpret explanations (e.g., SHAP values positive vs negative, caveats). Use documentation and tooltips.
Step 9: Balance Explainability vs Performance Trade-off
Sometimes transparent models (e.g. linear or tree) may not match performance of complex models. Use hybrid approaches: a complex model for scoring, plus an interpretable surrogate for explanation.
Step 10: Ethical Disclaimers & Disclosures
Where relevant, inform users when predictions are based on opaque models, caveats about confidence intervals, or potential biases.
Trade-offs, Challenges & Future Directions
Accuracy vs Interpretability
Often, more interpretable models sacrifice predictive power. Striking the right balance is crucial — you may use complex models but supplement them with surrogate explanations.
Explanation Faithfulness vs Simplicity
Simpler explanations are easier to digest but may misrepresent model behavior. Ensuring the explanation is faithful (true to the underlying model) is a challenge.
Stability and Consistency
Explanations should not be wildly inconsistent for very similar inputs. In sensitive domains, explanation stability is a measure of trust.
User Understanding & Misinterpretation
Even the best explanations can be misinterpreted. Researchers warn of “unmotivated trust” — where users overtrust models because explanations seem plausible.
Scalability & Latency
Generating explanations (e.g. SHAP for every prediction) may incur computational cost in real-time systems. You may need to sample, cache, or simplify.
Model Drift & Explanation Drift
As models are updated or drift occurs, explanations may shift. Monitoring how explanations evolve is critical to detect model degradation.
Contextual / Domain Awareness
Explainability techniques are domain-agnostic. But domain context must guide how explanations are framed. In a market research platform, you may prioritize explanations tied to demographic attributes, segments, or campaign levers.
Emerging Research & Advances
New approaches such as Holistic XAI (H-XAI) look to unify explanation modalities and context awareness.Researchers are also pursuing interactive and conversational explanations, more human-centric techniques, and methods that tie explanation and causality.
Conclusion
Explainability and transparency are essential for turning predictive models into trusted decision-making tools — especially when embedded in a market research platform. While predictive analytics software gives forecasts, it is the explanations that make those forecasts actionable, auditable, and defensible.
By combining techniques like SHAP, LIME, counterfactuals, surrogate models, and interactive visualization, and layering in monitoring, user education, versioning, and human loops, you can build systems that not only predict but also explain. The path forward includes balancing performance vs interpretability, managing explanation drift, and evolving towards more holistic explanation frameworks.
FAQ
Q: What is the difference between transparency and explainability in predictive analytics software?
A: Transparency refers to how much of the model’s internal logic is accessible (e.g. clear how features map to outputs). Explainability refers to the ability to communicate why a specific prediction was made in a comprehensible way (e.g. feature contributions). You need both for full accountability.
Q: Which explainability method works best in a market research platform?
A: There is no one-size-fits-all. SHAP is a strong default. LIME is flexible. For business users, counterfactuals or rule-based local explanations can be more intuitive. Interactive dashboards help. The best setup is to combine a few complementary methods and tailor by audience.
Q: Can explanations be generated in real time without slowing down predictions?
A: Yes — you can sample predictions, cache explanations, precompute for common cohorts, or generate simplified explanations for real-time. Heavy computation (e.g. full SHAP on each record) might happen offline as a fallback.
Q: How do I ensure explanations remain valid after retraining or drift?
A: Track explanation drift: e.g. feature importance changes over time, unusual sign flips. Version explanations alongside models. Use monitoring dashboards to flag unexpected shifts, and revalidate with domain experts.
Q: Do explanations always mean the model is correct?
A: No — explanations illuminate model logic, not ground truth. A model and its explanations could consistently amplify bias or error. Always validate predictions against real outcomes, and use explanations as aids, not guarantees.
